NVIDIA Nsight Visual Studio Edition 2.2 User Guide > CUDA Debugger > How To > Attach Debugging to a Running CUDA Process

With NVIDIA Nsight 2.2, you can attach the Visual Studio debugger to an already-running CUDA application. To do so, follow the steps outlined below.

  1. On the target machine (either local or remote, depending on your configuration), right-click on the Nsight Monitor icon on the taskbar and select Options.


    1. Select the CUDA tab.
    2. For the option Use this Monitor for CUDA attach, click the drop-down menu and select True. If this setting is not enabled, you will get a warning message in the attach dialog on the host machine.


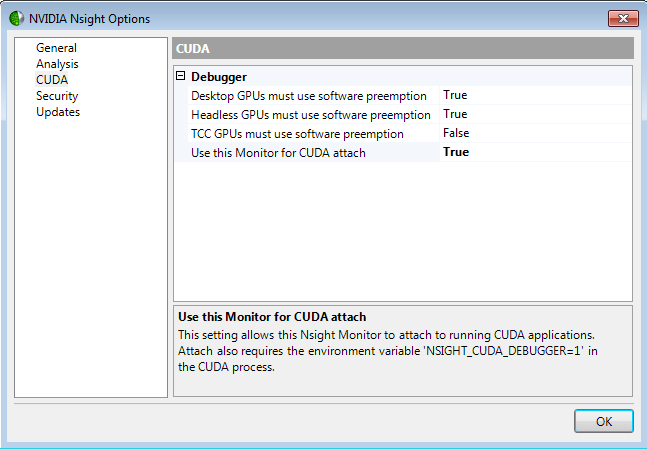
      This setting allows the Nsight Monitor to attach to CUDA applications that are already running. (Note that this is a setup procedure that will only have to be configured one time. The setting will remain set to "True" for all future debug sessions.)

    Attach also requires the environment variable NSIGHT_CUDA_DEBUGGER=1 in the CUDA process. This is useful for allowing attach to child processes, since the environment block is inherited by the child.

    This can be set system-wide, but then every process that uses CUDA will be attachable. This means the following:

    • Nvda.CUDA.Injection.dll is loaded in the application;
    • This dll has one thread;
    • Memory allocations are done in system memory; and
    • CUDA context and module loads are tracked by the injection.

    There should be no difference in the running application if this environment variable is not set.

  2. On the host machine, open your project in Visual Studio.
    1. This process will also work without a project. However, in that case, Visual Studio will not remember any breakpoints that are set.
    2. Ensure that the source paths in the debug symbols match up. The application has full paths to the source files, and the CUDA Debugger will match those up exactly, so the file names must match in order for breakpoints to hit.
      Note that if the project hits breakpoints when it is being debugged, then it will also work with attach.
  3. Go to DebugAttach to Process. (Or as an alternative, go to the Tools menu, and select Attach to Process.)
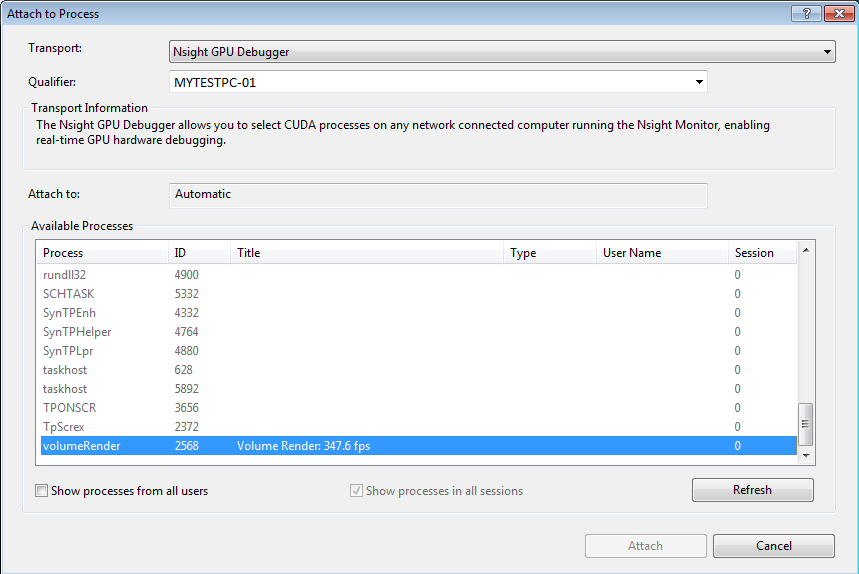
    This will open the Attach to Process dialog box.
  4. Click the drop-down menu next to the Transport field, and choose Nsight GPU Debugger.


  5. Ensure that your host machine name is listed in the Qualifier field.
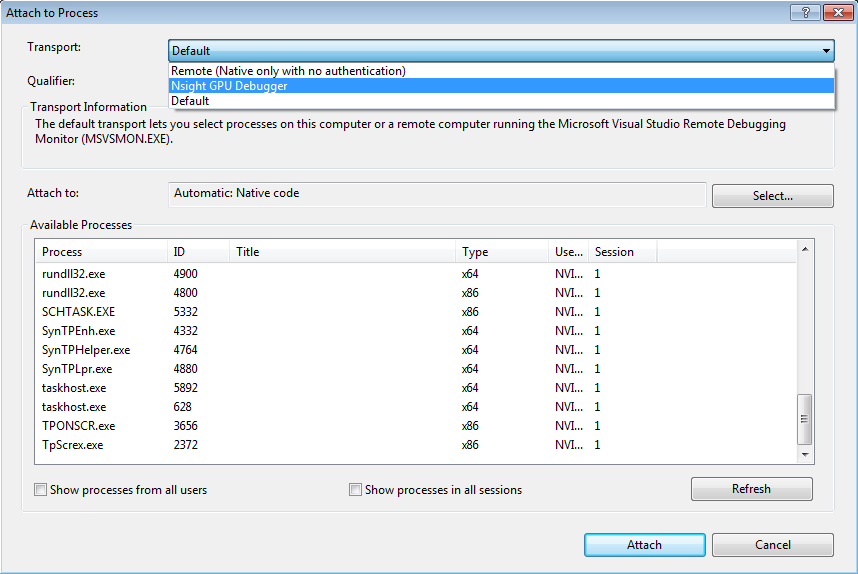
    Note that this field is blank by default; you will have to manually select your machine name the first time this dialog is opened.


  6. When you enter your computer's hostname in the Qualifier field, a list of available processes will appear in the dialog box.
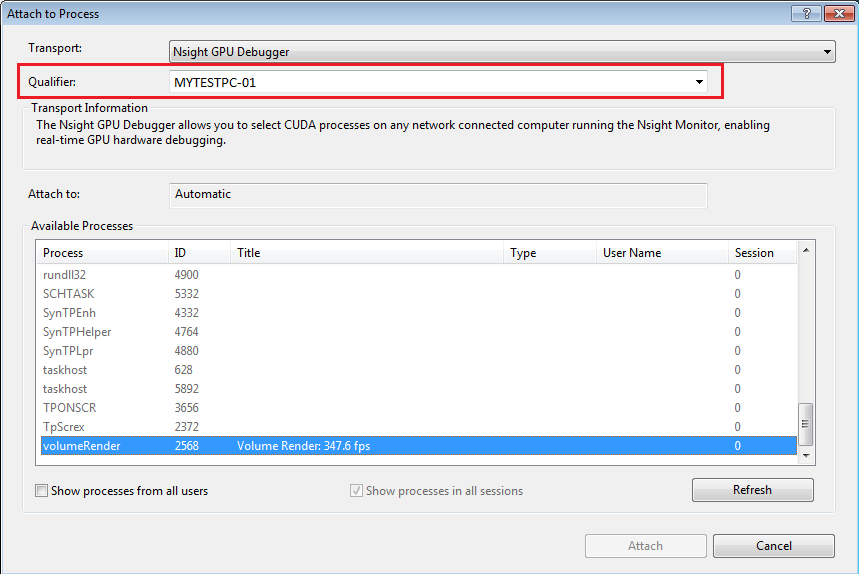
    1. If a process is grayed out and CUDA is listed in the Type column, it is already being debugged, so it is not attachable.
      Processes that are grayed out without CUDA in the Type column indicates that it has no CUDA usage in the process to be debugged.
    2. Processes that may be attached will appear normally, and the Attach button will be enabled.


  7. When you select your available process and click Attach, a debug session will begin, exactly as if you had used the NVIDIA Nsight menu in Visual Studio (NsightStart CUDA Debugging).


In this case, the CUDA Debugger will not stop in the middle of a kernel that is currently executing; it will wait for the next kernel launch.


To end, choose DebugStop Debugging. Note that this will terminate the application, as the Detach function is not currently supported.


NVIDIA® Nsight™ Development Platform, Visual Studio Edition User Guide Rev. 2.2.120522 ©2009-2012. NVIDIA Corporation. All Rights Reserved.