The NVIDIA Nsight Analysis tools contain a CUDA Profiler Activity that allows you to gather detailed performance information, in addition to timing and launch configuration details.
A CUDA Profiler activity consists of a kernel filter and a set of profiler experiments. Profile experiments are directed analysis tests targeted at collecting in-depth performance information for an isolated instance of a kernel launch.
The CUDA Profiler allows the user to collect an arbitrary number of experiments per kernel launch. Each profile experiment may require the target kernel to be executed one or more times in order to collect all of the required data. In the following examples, the individual iterations of a profile experiment are referred to as Experiment Passes. Executing all passes of all experiments for a target kernel launch is handled transparently to the analyzed application.
NVIDIA Nsight employs a replay mechanism for the executing experiment. A full snapshot of the mutable state of the target CUDA context is captured, before executing the experiment passes. For each experiment pass, the target kernel is executed once, followed by restoring the saved mutable state. Effectively, this rewinds the CUDA context to the exact state before the kernel launch. Subsequent experiment passes are guaranteed to operate on the same, unchanged input data and CUDA state.
As a result, the introduced performance overhead for profiling a single kernel launch is highly dependent on the following factors:
- The number of enabled profile experiments, or more specifically, the resulting number of experiment passes to be executed.
- The execution time of the target kernel on the GPU. Each experiment pass will launch the kernel exactly once. Some experiment passes modify the kernel binary, increasing the execution time.
- The overall size of the mutable state of the CUDA context at the time a kernel is profiled. The mutable state includes all allocated memory that is accessible from the kernel on both the GPU memory as well as the host system.
- The target system's overall performance to copy, save, and restore the mutable device memory, which may include transferring all device memory through the PCI bus to the host system.
Given these factors, profiling may incur a fairly large performance overhead to the target process. For that reason, it is recommended that the user limit kernel profiling to the specific kernels of interest, and also limit the enabled profiling experiments to only those that are actionable (with respect to the current code optimization efforts). This will help to maintain fast turnaround times.
To collect profile experiments:
- Open the Activity Document.
- Under Activity Type, select Profile CUDA Application.
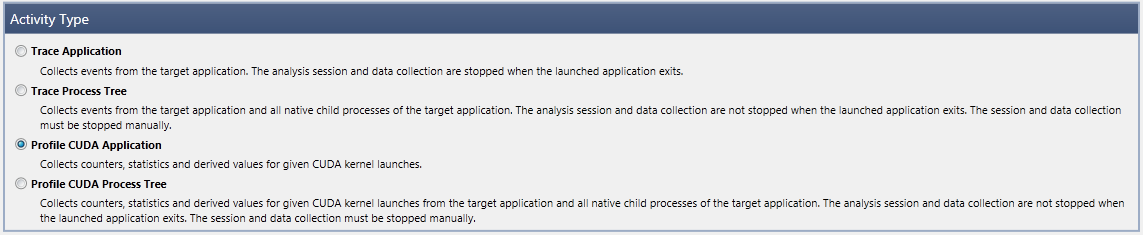
- The Experiment Settings section of the Activity Document opens. This allows the user to select the subset of kernels that should be profiled, and configure the experiments to be collected.
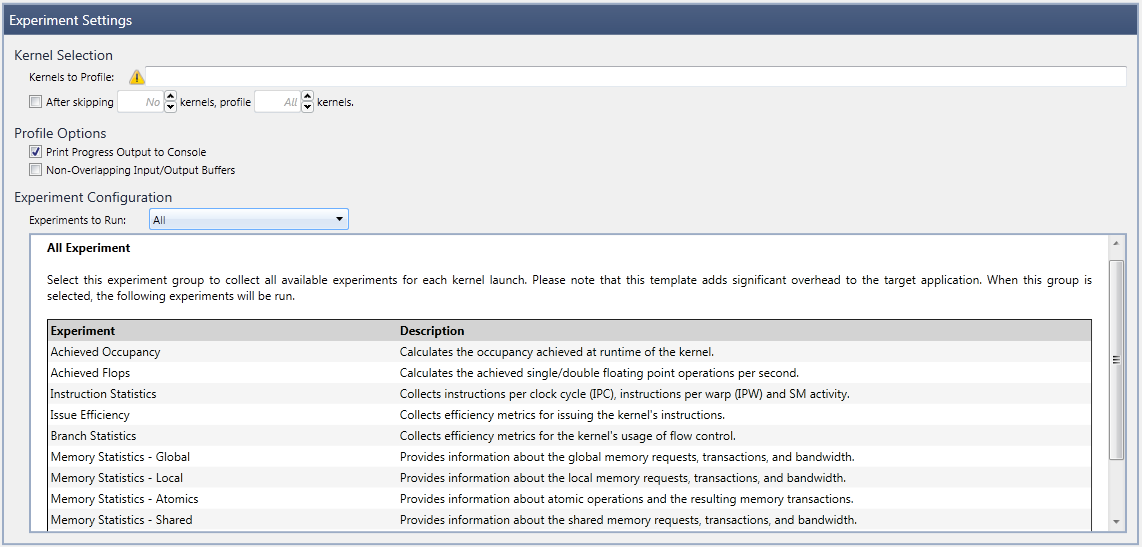
- The section Kernel Selection allows the user to configure a filter to restrict the Kernels to Profile. This filter accepts regular expressions using Perl syntax. All launches for which the kernel name matches the configured filter will be profiled. Specifically, the filter is matched against the kernel's non-mangled name (not mangled name).
In case no filter is set at all or the specified filter is invalid, all kernel launches for all kernels will be profiled. As this can pose a high performance overhead, a warning icon will be displayed.
- If there is a certain number of kernels you wish to profile, you can select the checkbox After skipping N kernels, profile X kernels. This allows you to further customize the kernels that are analyzed in the final output. If the user specifies a number in the X field, the first X number of kernel launches which match the kernel filter will be profiled. Subsequent kernel launches will not be profiled, regardless of the result of the kernel filter. The counter for the capture limit is reset with each new capture session. For example, enter the following:
After skipping 5 kernels, profile 80 kernels.
In this scenario, the first 5 kernels will be skipped, then kernels 6 through 85 will be profiled.
 | Note that the counters for skipping kernels and for limiting the profile session are applied after the Kernel RegEx Filter. In other words, kernel names that do not match the Kernel RegEx filter (if set) will not be counted toward the total number of kernels in the two fields (N kernels and X kernels) described above. |
- The Profile Options allow the user to configure the following parameters of a profile activity:
- Print Process Output to Console enables writing detailed information about the progress of the experiment data collection to the standard output (
stdout). - Non-Overlapping Input/Output Buffers allows you to specify that all profiled kernels do not change the contents of their input buffers during execution, or call device malloc/free or new/delete, that leave the device heap in a different state. Specifically, a kernel can malloc and free a buffer in the same launch, but it cannot call an unmatched malloc or an unmatched free. If enabled, this can vastly improve experiment collection, as there is no need to save and restore the mutable state for each experiment pass.
| Note that if the option Non-Overlapping Input/Output Buffers is enabled mistakenly (that is, the profiled kernels do overwrite their input buffers or use unmatched device malloc/free), the behavior of the profiled application is completely undefined. As a consequence, the application might terminate abnormally, or the collected profile data may be invalid. |
- Under Experiment Configuration, you can define the set of profile experiments to collect. There are two different ways to specify the Experiments to Run:
- Experiment Templates are predefined groups of experiments that focus on a specific profiling task, or a certain field of interest. Upon selection of an experiment template, a short description (as well as the list of enclosed experiments) is displayed in the lower section of the activity configuration page.
- Custom Experiment Configuration allows you to manually specify the list of experiments to execute. After selecting this option, the lower portion of the experiment settings changes to the Advanced Experiment configuration.
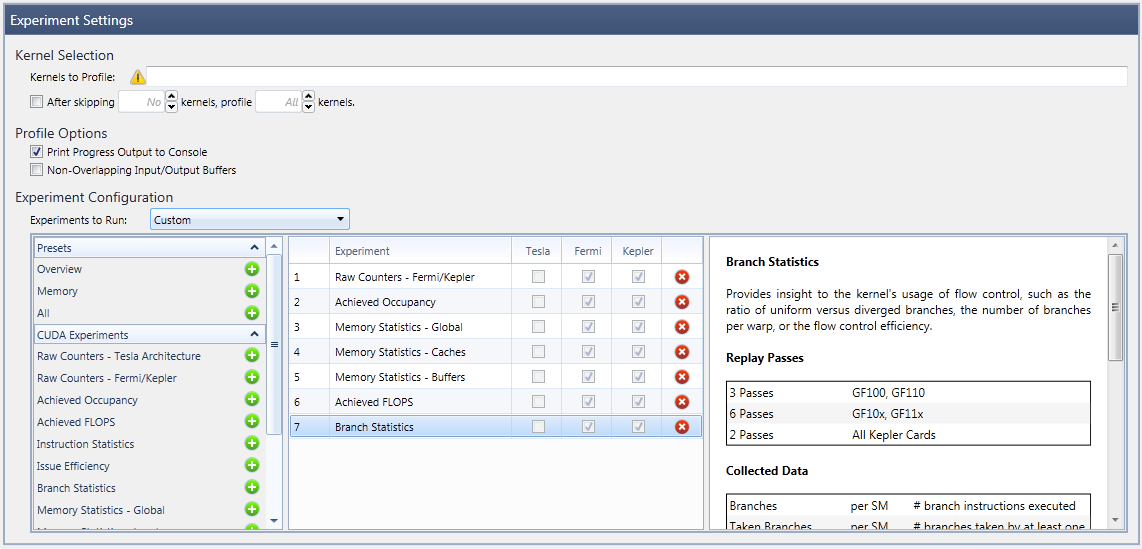
As shown here, on the left is a list that includes the available experiment templates, in addition to all available individual experiments. By selecting an item from that list, the experiment is added to the active experiments in the middle column.
Note that some experiments can be added multiple times to the middle list, while others are only allowed to be added once. Specifically, it is possible to collect an arbitrary number of RAW counter experiments, all with different counter configurations.
All experiments in the middle section will be executed for each profiled kernel launch, as long as it is supported on the current GPU device architecture, which is indicated in the device architecture columns.
Based on the experiment selection in the middle table, the right document area will show a brief summary, including information such as the required experiment passes, the collected counter data, or the derived metrics. In addition, a few experiments expose further configuration options through the panel on the right. For example, the RAW counter experiments expose the list of available counters per target device.
To View Profiler Experiment Results
Profiler experiment results are displayed per CUDA launch.
- In the report, navigate to the CUDA Launches report page.
- Select a kernel launch in the table.
- Some experiments add columns to the launches table. These can be used to help sort and filter launches.
- In the correlation pane, expand the Experiment Results node.
- Under Experiment Results, select the results you would like to see.
- Many experiments have multiple detail panes. The tab selector can be used to switch between detail panes in an experiment.
Changing the selection in the CUDA Launches table will update both the correlation pane and the details pane.
Profiler Experiments
The following sections list all available experiments for NVIDIA Nsight 2.2 and provide descriptions on the collected data, metrics, and the visualization used in the report pages.
Achieved Occupancy
Multiprocessor occupancy is the ratio of active warps to the maximum number of warps supported on a multiprocessor of the GPU. Theoretical occupancy is the maximum occupancy given the execution configuration. This experiment captures the achieved occupancy, which is the number of active warps per clock cycle divided by maximum warps per multiprocessor.
This experiment reports the achieved occupancy, the theoretical occupancy, and the limiting factors for the theoretical occupancy.

|
Note that higher occupancy does not always equate to higher performance; there is a point of diminishing returns, above which additional occupancy does not improve performance. However, low occupancy always interferes with the ability to hide memory latency, resulting in performance degradation.
|
The achieved occupancy may be lower than the theoretical occupancy for the following reasons:
- The total number of blocks in the execution configuration is insufficient to saturate the device.
- The thread blocks have high variance in execution times, often resulting in low number of active warps toward the end of the kernel execution.
- The warps in thread blocks have high variance in execution times resulting in poor number of active warps throughout the kernel execution.
Replay Passes
| 1 Pass |
All Fermi and Kepler cards
|
Collected Data
| Active Warps |
per SM
|
# warps that were active on the SM per cycle |
| Active Cycles |
per SM
|
#cycles in which at least one warp was active on the SM |
|
|
The term SM refers to a Streaming Multiprocessor.
|
Metrics
| Achieved Occupancy |
100 * {Active Warps} / {Active Cycles} / {Max Warps per SM}
|
Experiment Detail Pane
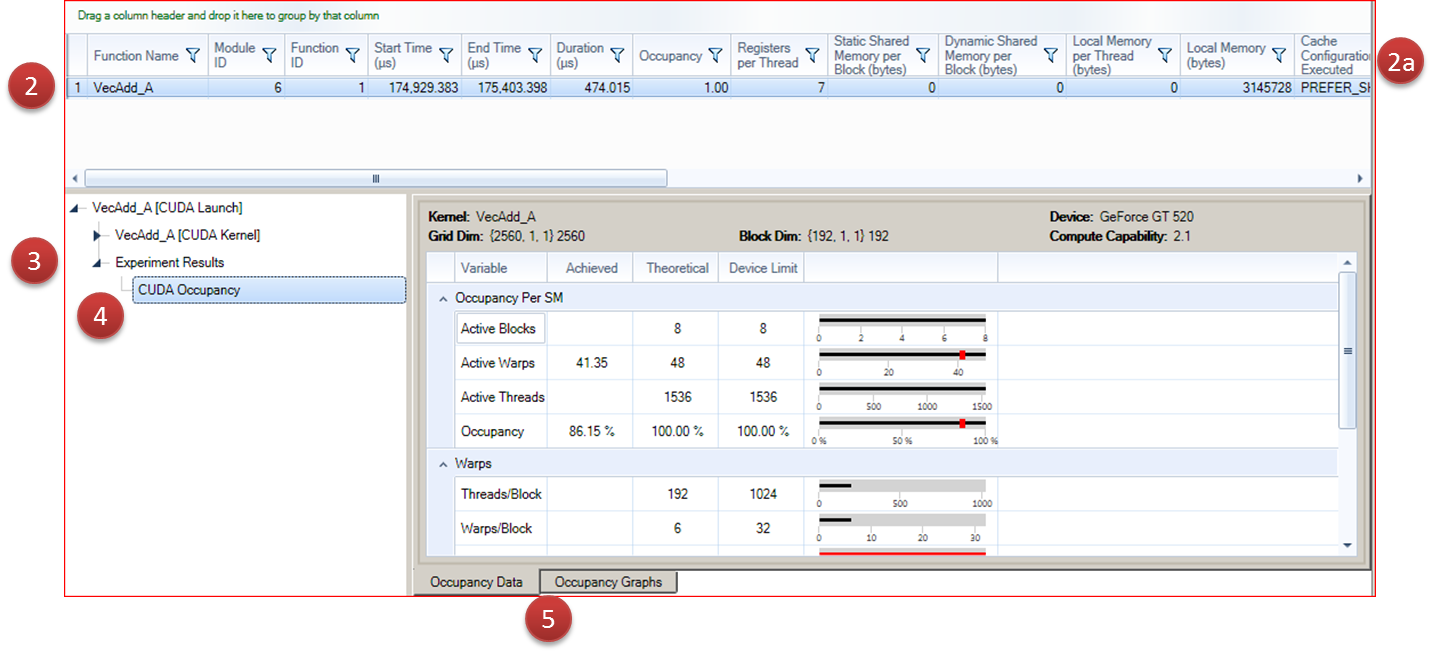
The CUDA Profiler Experiment results are reported on the CUDA Launches report page in the detail pane.
The achieved occupancy experiment detail panes are based on the Occupancy Calculator spreadsheet, which is included as part of the CUDA toolkit. Two visualization tabs are available:
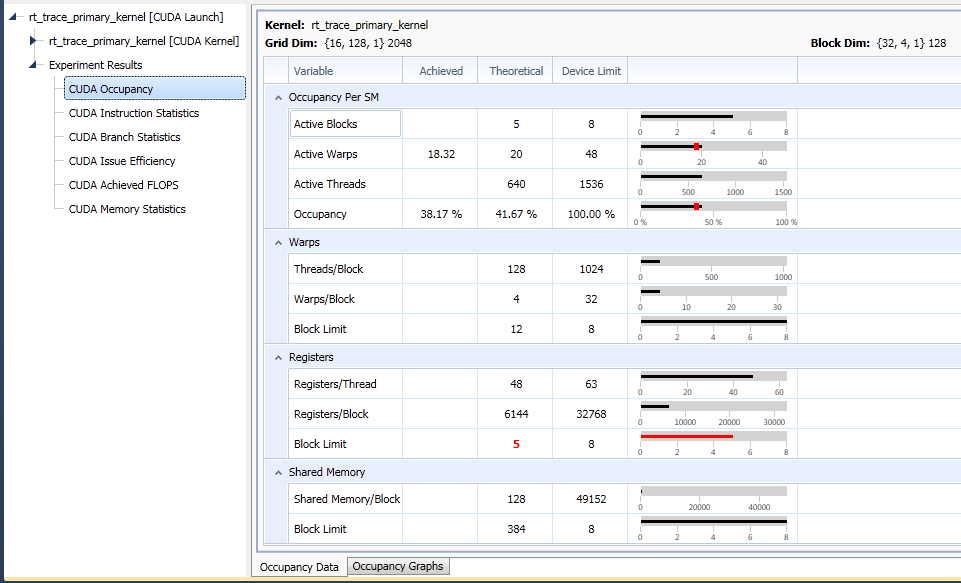
The Occupancy Data tab details all key information that defines the occupancy for the profiled kernel launch. For each metric in the table, three different values may exist:
- The Device Limit column indicates the capabilities of the target GPU. These values are solely dependent on the compute capabilities of the CUDA device the kernel was executed on.
- The Theoretical Maximum for each value is derived solely from the execution configuration of the kernel (i.e., the number of threads per block, the registers used per thread, and the shared memory required per block). Any combination of these properties can be the limiting factor for the overall theoretical occupancy. If it becomes a limiting factor, the corresponding property row is highlighted in red.
- The Achieved Occupancyis the actual occupancy that is collected, using hardware performance counters.
The relationship between all three variants of each metric is also displayed in a graph on the right side. The x-axis scale equals the device limit. The bar indicates the theoretical limit. The achieved value is indicated by a red mark, if applicable.
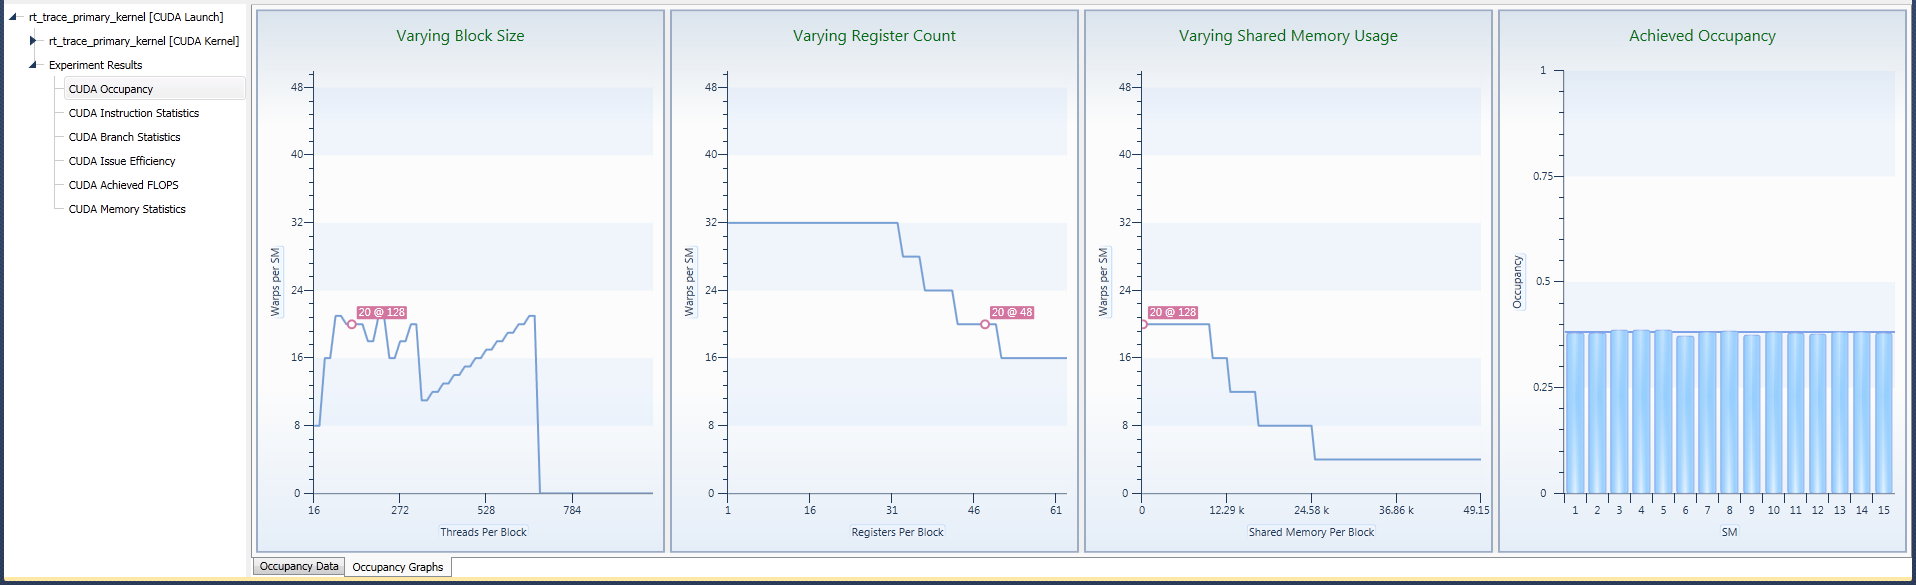
The Occupancy Graphs tab shows possible changes in the theoretical occupancy achieved by varying execution configuration. Graphs are displayed for varying thread block sizes, registers per thread, and shared memory usage. Thread block size can be manipulated by changing the launch dimensions. Registers per thread can be manipulated by compiler or JIT settings or changes ot the code, and shared memory usage can be manipulated by code changes or changes to the dynamic shared memory launch parameter.
The Achieved Occupancy graph on the right shows the achieved occupancy per shared multiprocessor (SM), with the average across all SMs being equal to the value reported in the occupancy data table. High variation in achieved occupancy across the SMs may indicate an insufficient granularity of the kernel thread blocks causing imbalanced workloads or are often the result of flow control decisions being based on the thread block index.
Achieved FLOPs
The Achieved FLOPs experiment provides statistics on the floating point operations of the kernel. For single-precision and double-precision, the execution count per instruction type as well as the operations per second (FLOPs) is reported.
Replay Passes
| 2 Passes |
All Fermi and Kepler cards
|
Collected Data
| Executed Floating Point Operations |
per Kernel
|
Number of floating point operations executed. Fused multiply-add (FMA) and reciprocal square root (RSQ) account for two operations. All other instructions count as one operation. |
| Elapsed Time |
|
Elapsed time for the kernel execution |
Metrics
| FLOPs |
{Executed Floating Point Operations} / {Elapsed Time}
|
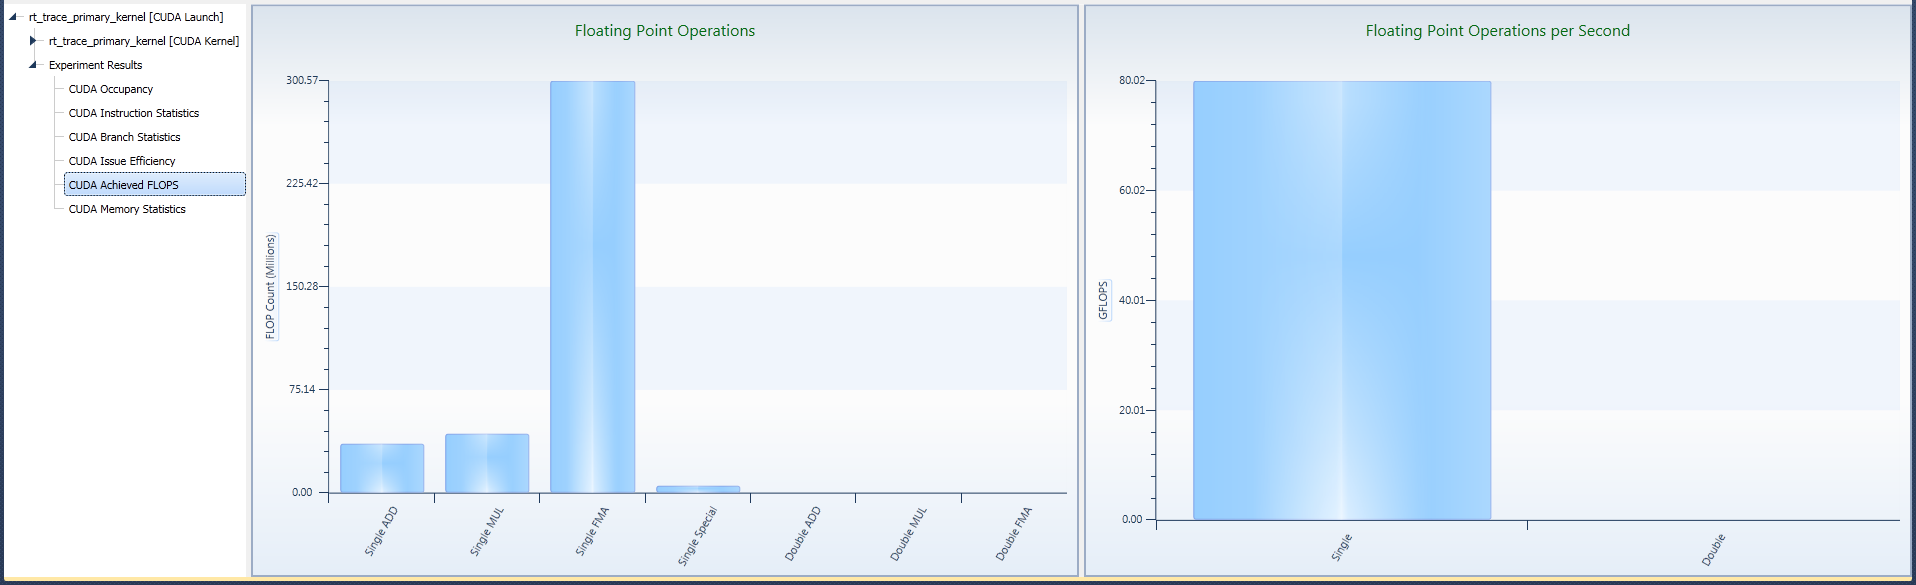
Experiment Details Pane
The left chart shows the total count of floating point operations executed during the kernel execution for each of the tracked groups of operations. On the right, the achieved single-precision floating point operations per second and its double-precision counterpart are shown.
Instruction Statistics
The Instruction Statistics experiment provides key metrics to evaluate the efficiency to execute the kernel's instruction on the target device, including instructions per clock cycle (IPC), instruction serialization, SM activity, and instructions per warp (IPW).
Instructions Per Cycle
For devices of compute capability 2.x, a multiprocessor consists of:
- For devices of compute capability 2.0:
- 32 CUDA cores for integer and floating-point arithmetic operations,
- 4 special function units for single-precision floating-point transcendental functions.
- For devices of compute capability 2.1:
- 48 CUDA cores for integer and floating-point arithmetic operations,
- 8 special function units for single-precision floating-point transcendental functions,
- 2 warp schedulers.
- At every instruction issue time, each scheduler issues the following for some warp that is ready to execute (if any):
- 1 instruction for devices of compute capability 2.0,
- 2 instructions for devices of compute capability 2.1,
The first scheduler is in charge of the warps with an odd ID, and the second scheduler is in charge of the warps with an even ID.
|
|
When a scheduler issues a double-precision floating-point instruction, the other scheduler cannot issue any instruction.
|
A warp scheduler can issue an instruction to only half of the CUDA cores. To execute an instruction for all threads of a warp, a warp scheduler must therefore issue the instruction over two clock cycles for an integer or floating-point arithmetic instruction.
Instructions Executed is the sum of instructions issued by the two schedulers not including replays.
Instructions Issued is the sum of the instructions issued by the two schedulers, including replays. Instruction replays only occur for memory operations. Shared memory loads/stores require replays for each bank conflict. Global and local memory replays occur if a request accesses multiple cache lines, or the request size per thread is greater than 32 bits.
Executed IPC and Issued IPC metrics are a measure of instruction throughput when the multiprocessor is active. Instruction Serialization is the percentage of replayed instructions to issued instructions. This can be used to understand how memory operations are affecting instruction issue rate.
Load Balancing
For devices of compute capability 2.x, the global work distribution engine schedules thread blocks to multiprocessors. Each thread block is 1 to 32 warps. The multiprocessor Active Cycles counter is the number of clock cycles the multiprocessor was managing at least one warp.
Active cycles counter can be used to determine load balancing problems caused by inconsistent work per thread or insufficient number of blocks in a launch. If the program executes the kernel concurrently with other kernels then multi-processor load balancing is not as critical as using active cycles counter per multiprocessor to determine the major influence on the kernel’s duration.
The Warps Launched counter can be used to determine if you have equal work assigned to each SM. Warps launched can be converted to Thread Blocks Launched (also known as CTAs launched) by the following formula:
Thread Blocks Launched = Threads Per Block + (WARP_SIZE – 1)/ Warps Launched
Replay Passes
| 1 Pass |
GF100, GF110, all Kepler cards |
| 2 Passes |
GF10x, GF11x
|
Collected Data
| Active Cycles |
per SM |
# cycles the SM had at least one active warp |
| Instructions Executed |
per SM |
# instructions executed not including replays |
| Instructions Issued |
per SM |
# instructions issued including replays |
| Warps Launched |
per SM
|
# warps launched on an SM |
| Elapsed Clock |
|
Elapsed clock ticks for the kernel execution |
Metrics
| Issued IPC |
{Instructions Issued} / {Active Cycles} |
| Executed IPC |
{Instructions Executed} / {Active Cycles} |
| Instruction Serialization |
({Instructions Issued} - {Instructions Executed}) / {Instructions Issued} |
| SM Activity |
{Active Cycles} / {Elapsed Clock} |
| IPW |
{Instructions Executed} / {Warps Launched}
|
Experiment Details Pane
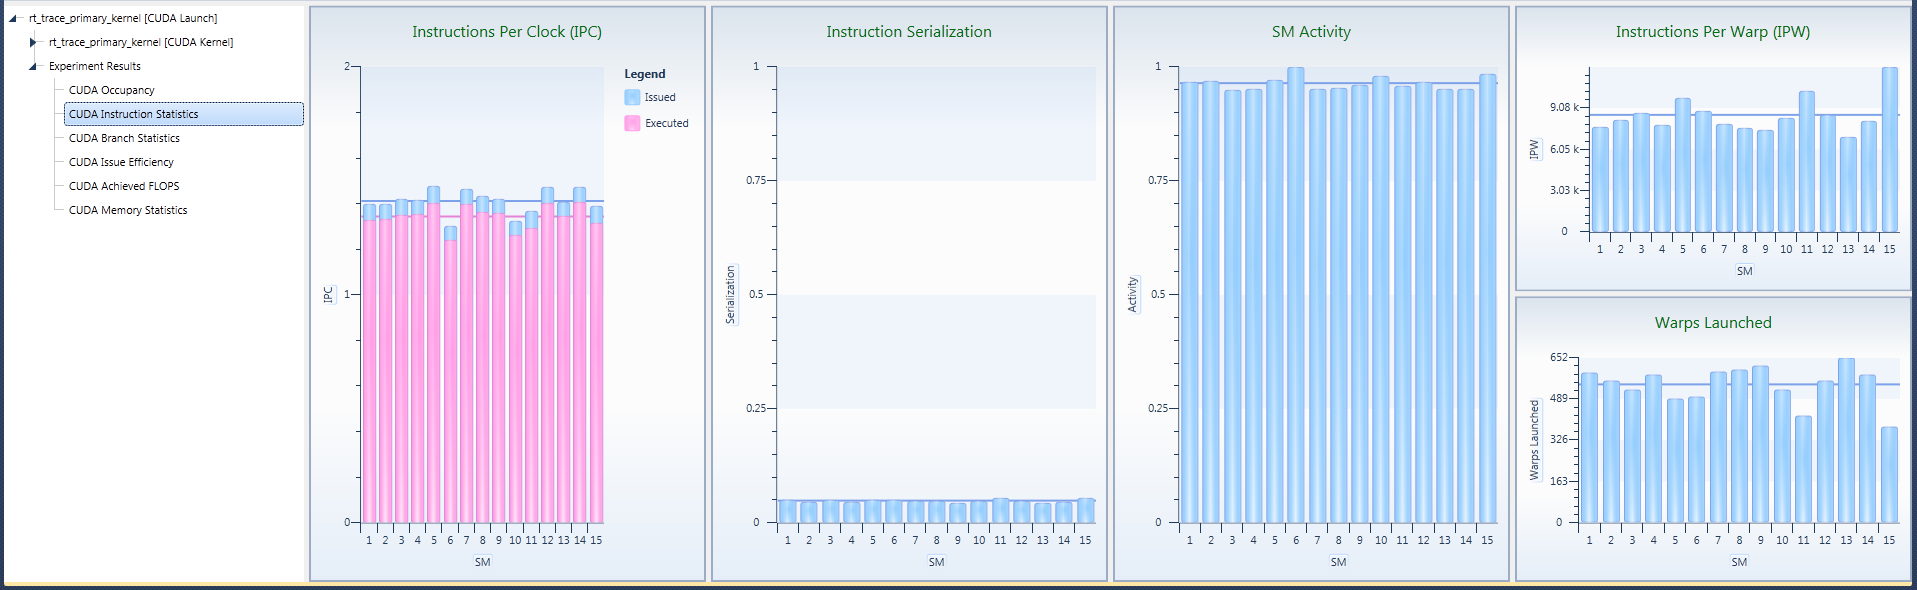
The CUDA Instruction Statistics detail pane contains five charts:
- Instructions Per Clock
This chart is a z-ordered column graph that shows instructions executed and instructions issued metric.
Instructions Issued takes all replayed instructions into account and is consequently always equal to or greater than the number of executed instructions.
The theoretical maximum IPC is defined by the target GPU device only. The y-axis of the graph scales according to this theoretical maximum.
Common reasons for obtaining low executed IPC include:- Poor memory access patterns force input instructions to be replayed multiple times, causing resources to be spent on those replayed operations, rather than make further progress executing the kernel. (For details on how to further analyze performance bottlenecks caused by memory access pattern, please refer to the global/shared memory experiments.)
- The instruction mix includes many high latency instructions, which offer a lower IPC than the device’s theoretical maximum. Those instructions typically include double-precision floating point operations and transcendental functions. The Achieved FLOPS experiment may help in identifying the instruction mix for floating point operations.
- The kernel has many dependencies between subsequent instructions, and the available parallelism is not sufficient to hide those dependencies.
For further details on how to identify this issue, refer to the Issue Efficiency experiment - specifically the instruction dependency cycles and the max dependency IPC. - The overall parallelism of the kernel grid is too low to efficiently hide latency. Verify the Achieved Occupancy experiment to double check if a sufficient number of warps can be executed on each SM.
- Instruction Serialization
This chart further details the difference between executed instructions and issued instructions. It denotes the ratio of replayed instructions per issued operation. High serialization typically indicates bad memory access patterns.
- SM Activity
This chart show the percentage of time each multiprocessor was active during the launch duration. A SM is considered to be active if at least one warp is currently assigned for execution.
An SM can be inactive, even though the kernel grid is not yet completed, due to high workload imbalances. Such load balancing issues between the SMs can be caused by a few factors: different execution times for the kernel blocks, variations between the number of scheduled blocks per SM, or a combination of the two.
- Instructions Per Warp
This chart shows the average instructions per warp for each SM and for the kernel. This metric can be used to spot any variations in instructions executer per warp. High variations in this metric are typically caused by following different flow control paths through the kernel code.
- Warps Launched
This chart shows the warps launched per SM, and the average warps launched per SM. Large differences in the number of warps executed per SM are most commonly the result of providing an insufficient amount of parallelism with the kernel grid. More specifically, the number of kernel blocks is too low to make good use of all available compute resources. A high variation in warps launched is only a concern if SM activity is low on one or more SMs. In this case, you should consider a different method for partitioning your workload that either results in less variance in duration per warp or the execution of many more thread blocks, so that the work distributor can dispatch work more evenly.
Issue Efficiency
Issue Efficiency provides information about the device's ability to issue the instructions of the kernel. The data reported includes execution dependencies, eligible warps, and SM stall reasons.
For devices of compute capability 2.x, a multiprocessor has two warp schedulers. Each warp scheduler manages at most 24 warps, for a total of 48 warps per multiprocessor. The kernel execution configuration may reduce the runtime limit. For information on occupancy, see the Achieved Occupancy experiment. The first scheduler is in charge of the warps with an odd ID, and the second scheduler is in charge of warps with an even ID.
At every instruction issue time, each scheduler will pick an eligible warp from its list of active warps and issue an instruction. A warp is eligible if the instruction has been fetched, the execution unit required by the instruction is available, and the instruction has no dependencies that have not been met.
The schedulers report the following statistics on the warps in the multiprocessor:
- Active Warps – A warp is active from the time it is scheduled on a multiprocessor until it completes the last instruction. The active warps counter increments by 0-48 per cycle. The maximum increment per cycle is defined by the theoretical occupancy.
- Eligible Warps – An active warp is eligible if it is able to issue the next instruction. Warps that are not eligible will report an Issue Stall Reason. This counter will increment by 0-ActiveWarps per cycle.
- Zero Eligible Warps – This counter increments each cycle by 1 if neither scheduler has a warp that can be issued.
- One Eligible Warp – This counter increments each cycle by 1 if only one of the two schedulers has a warp that can be issued.
- Warp Issue Holes – This counter increments each cycle by the number of active warps that are not eligible. This is the same as Active Warps minus Eligible Warps.
- Long Warp Issue Holes – This counter increment each cycle by the number of active warps that have not been eligible to issue an instruction for more than 32 clock cycles. Long holes indicate that warps are stalled on long latency reasons such as barriers and memory operations.
- Issue Stall Reasons – Each cycle each ineligible warp will increment one of the issue stall reason counters. The sum of all issue stall reason counters is equal to warp issue holes. A ineligible warp will increment the
- Instruction Fetch stall reason if the next assembly instruction has not yet been fetched.
- Execution Dependency stall reason if an input dependency is not yet available. This can be reduced by increasing the number of independent instructions.
- Data Requests stall reasons if the request cannot currently be made as the required resources are not available, or are fully utilized, or too many operations of that type are already outstanding. In case data requests make up a large portion of the stall reasons, you should also run the memory experiments to determine if you can optimize existing transactions per request or if you need to revisit your algorithm.
- Texture stall reason if the texture sub-system is already fully utilized and currently not able to accept further operations.
- Synchronization stall reason if the warp is blocked at a
__syncthreads(). If this reason is large and the kernel execution configuration is limited to a small number of blocks then consider dividing the kernel grid into more thread blocks.
Replay Passes
| 29 Passes |
All Fermi cards |
| 7 Passes |
All Kepler cards |
Collected Data
| Active Warps |
per SM |
# warps that were active on the SM per cycle |
| Active Cycles |
per SM |
# cycles the kernel was active on the SM |
| Eligible Warps |
per SM |
# active warps that were eligible to issue an instruction per cycle |
| Zero Eligible Warps |
per GPU |
# cycles no warp was eligible to issue an instruction |
| One Eligible Warp |
per GPU
|
# cycles only a single warp was eligible to issue an instruction |
| Warp Issue Holes |
per SM
|
# warps not eligible to issue an instruction |
| Long Warp Issue Holes |
per SM |
# warps not eligible to issue an instruction for more than 32 cycles |
| Instructions Executed |
per SM |
# instructions executed not including replays |
| Issue Stall Reasons |
per GPU |
# warps that were not eligible to issue to an instruction to one of the following reasons: Instruction Fetch, Execution Dependency, Synchronization, Data Requests, Texture, or Other. |
Experiment Detail Pane
The experiment detail pane groups information into three tabs:
- Eligible Warps
- Issue Dependencies
- Issue Stalls
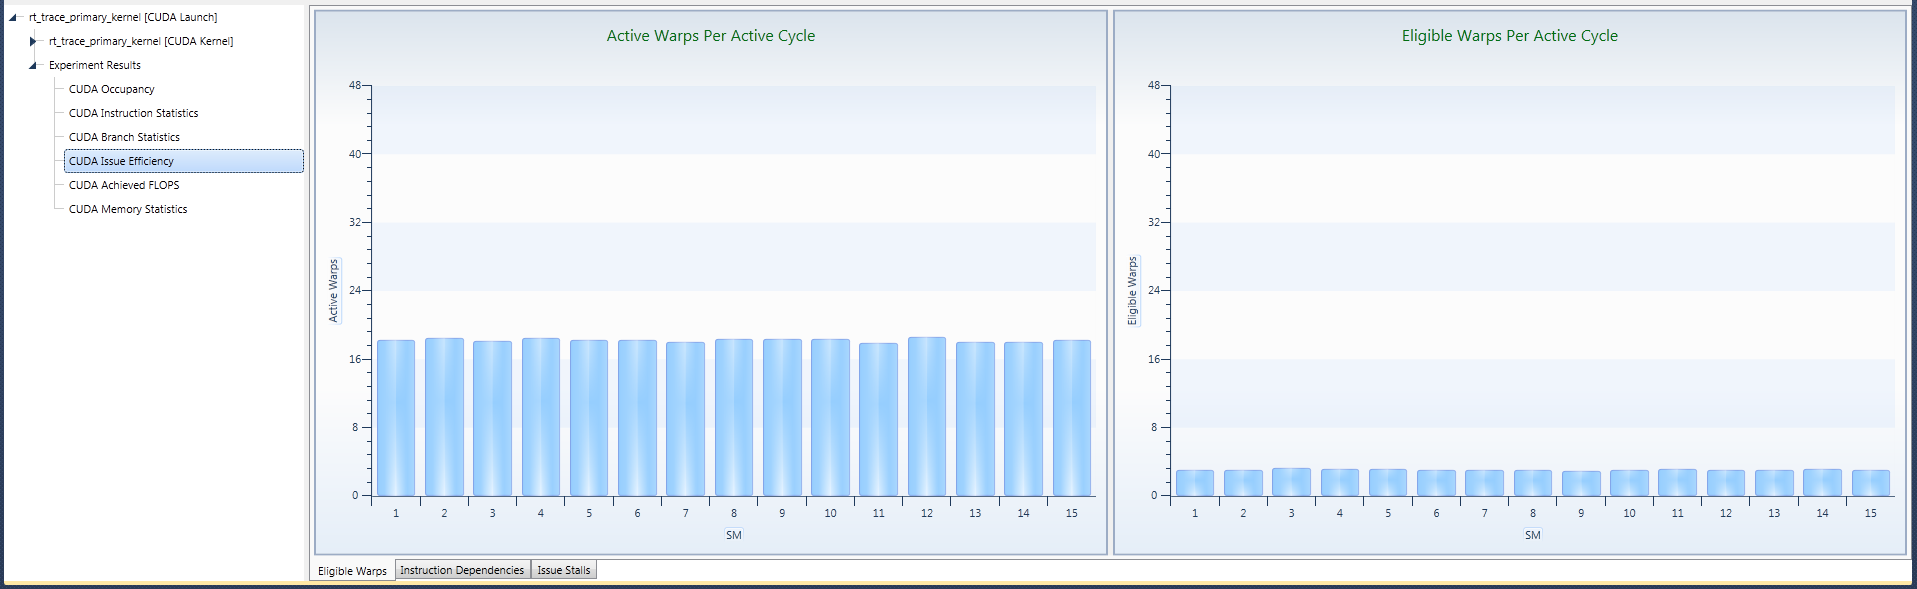
1. Eligible Warps Tab
Among all of the warps currently assigned to an SM, only a few may be eligible to issue their next instruction. Ineligible warps may have to wait on the completion of previously issued instructions, require currently unavailable device resources, or all other warps to reach a synchronization point. Having no eligible warp can lead to missing out on issuing a new instruction, and ultimately lowers the achieved IPC.
|
|
Some GPU devices can issue multiple instructions per cycle. For such devices having only one eligible warp is not sufficient to utilize all available compute resources. Hence, it is recommended to aim at having at least two warps eligible at any given time of the kernel execution.
|
One prerequisite of having enough eligible warps is to provide a sufficient number of Active Warps per Active Cycle on each SM. The longer each warp stays in a non-eligible state, the more active warps are necessary to hide the latency until a warp becomes eligible again.
|
|
The ratio of the active warps per cycle to the maximum number of active warps per SM is also referred to as achieved occupancy. Further details can be found in Achieved Occupancy experiment.
|
For each SM, the number of active warps is the upper limit of the number of the eligible warps. It is recommended to have at least two warps eligible at all times. However, further increasing this number has typically no additional effect on the performance of executing the kernel.
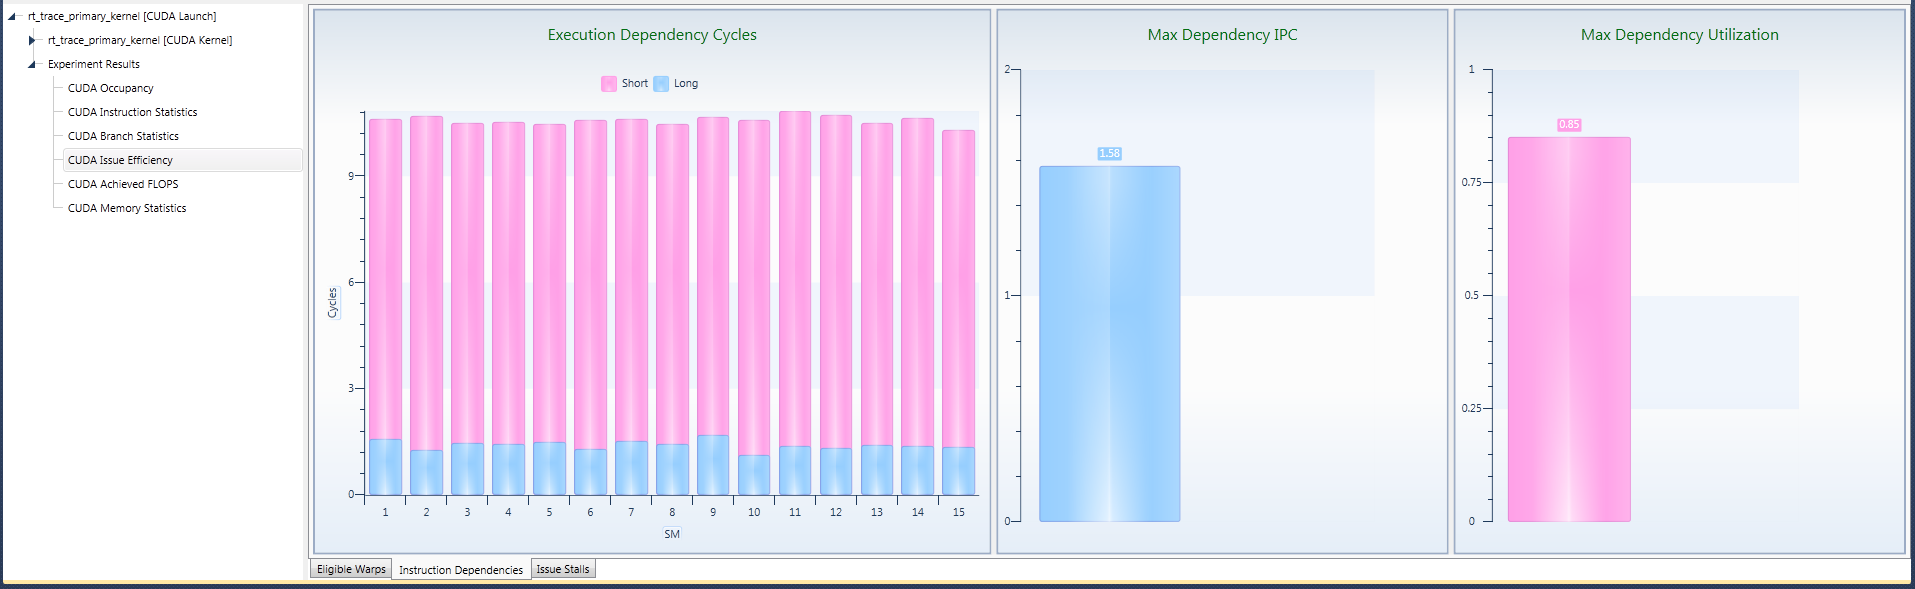
2. Issue Dependencies Tab
Instruction dependencies can keep warps in an ineligible state for long period of times. In other words, in order to be executable, all inputs for an instruction need to be fully calculated and readily available to the multiprocessor. If this is not the case, the warp cannot issue this instruction, and needs to wait until the dependencies are resolved.
The Execution Dependency Cycles provide an estimate on how many cycles on average each instruction needs to wait, until all dependencies are fully resolved. The distribution between short and long dependency cycles provide further insight as to how often a warp was stalled for more than 32 cycles. These long dependencies are typically caused by dependencies on global memory instructions or texture operations, or stalls at barriers.
Derived from the dependency cycles and the active warps, the Max Dependency IPC defines an upper bound for the kernel's achievable instruction throughput. Closely related is the Max Dependency Utilization, which describes the ratio of the achieved IPC versus the Max Dependency IPC.
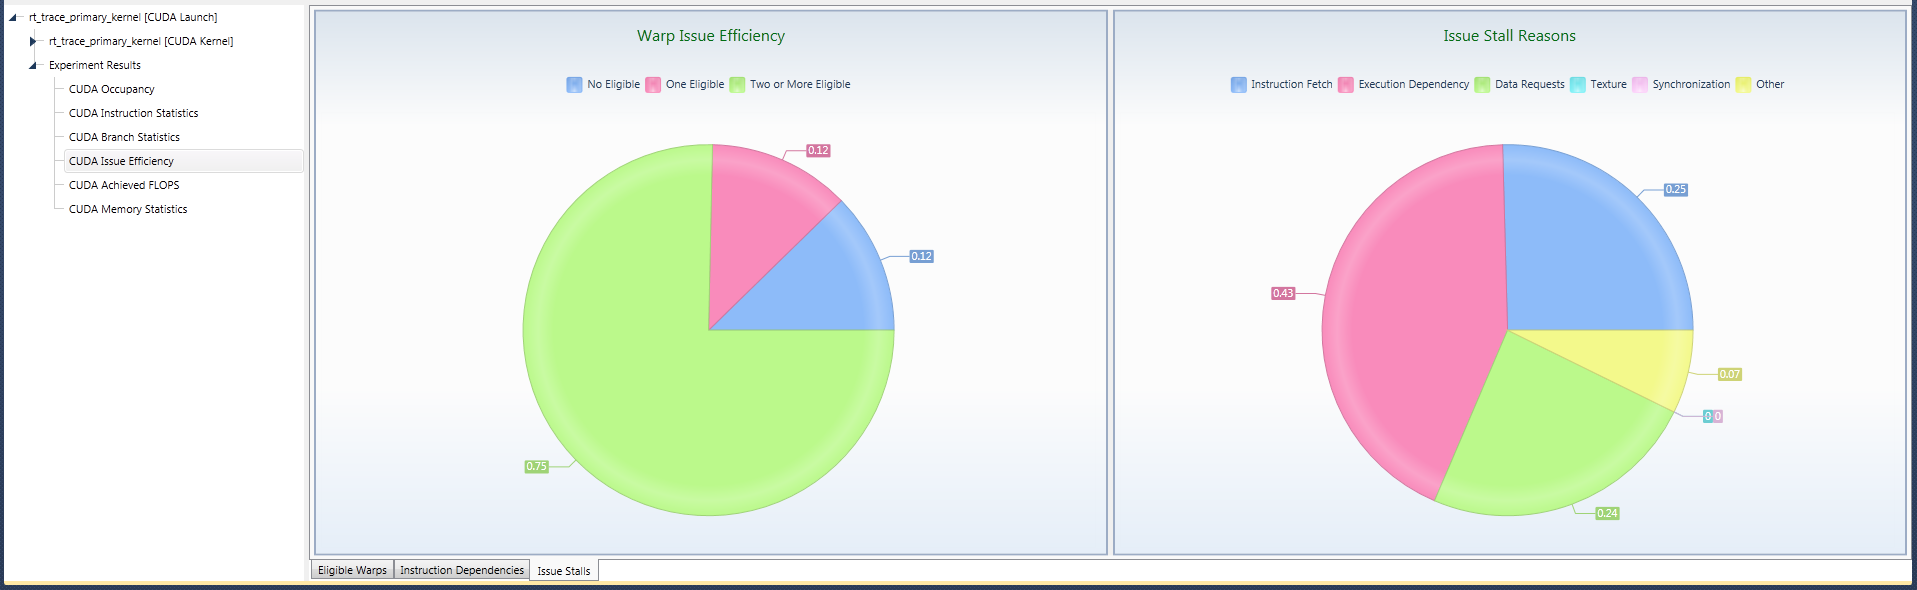
3. Issue Stalls Tab
The Warp Issue Efficiency shows the overall ratios (averaged across all SMs) of having (a) no eligible warp, (b) only a single eligible warp, or (c) two or more eligible warps, across all active cycles of a kernel execution. Having less than two eligible warps can cause some (or all) schedulers to fail to issue an instruction.
|
|
Optimizations based on the stall reasons should only be done if the percentage of cycles that 0 or 1 warp is eligible to issue is large. If this percentage is low, then there are sufficient eligible warps per cycle for the scheduler to choose from.
|
Branch Statistics
Branch Statistics provide insight to the kernel's usage of flow control, such as the ratio of uniform versus diverged branches, the number of branches per warp, or the flow control efficiency.
Replay Passes
| 3 Passes |
GF100, GF110 |
| 6 Passes |
GF10x, GF11x
|
| 2 Passes |
All Kepler cards |
Collected Data
| Branches |
per SM |
# branch instructions executed |
| Taken Branches |
per SM |
# branches taken by at least one thread |
| Diverged Branches |
per SM |
# branches that were evaluated differently across a warp |
| Warps Launched |
per SM
|
# warps launched on an SM |
| Instructions Executed |
per SM |
# instructions executed not including replays |
| Thread Instructions Executed |
per SM
|
Sum of active threads for all executed instructions. |
|
|
Note that the semantics of the branch counters slightly differs between Fermi and Kepler architectures.
For example, on Fermi, every EXIT instruction counts as a branch. However, on Kepler, non-diverging EXIT instructions are no longer considered a branch. Consequently, the results of the branch experiments might differ between the two architectures, even when the executed assembly code is the same.
|
Metrics
| Branch Efficiency |
({Branches} - {Diverged Branches}) / {Branches}
|
| Control Flow Efficiency |
{Thread Instructions Executed} / {Instructions Executed} / {Warps Size}
|
| Branch Condition (false) |
{Branches} - {Taken Branches} |
| Branch Condition (diverged) |
{Diverged Branches}
|
| Branch Condition (true) |
{Taken Branches} - {Diverged Branches}
|
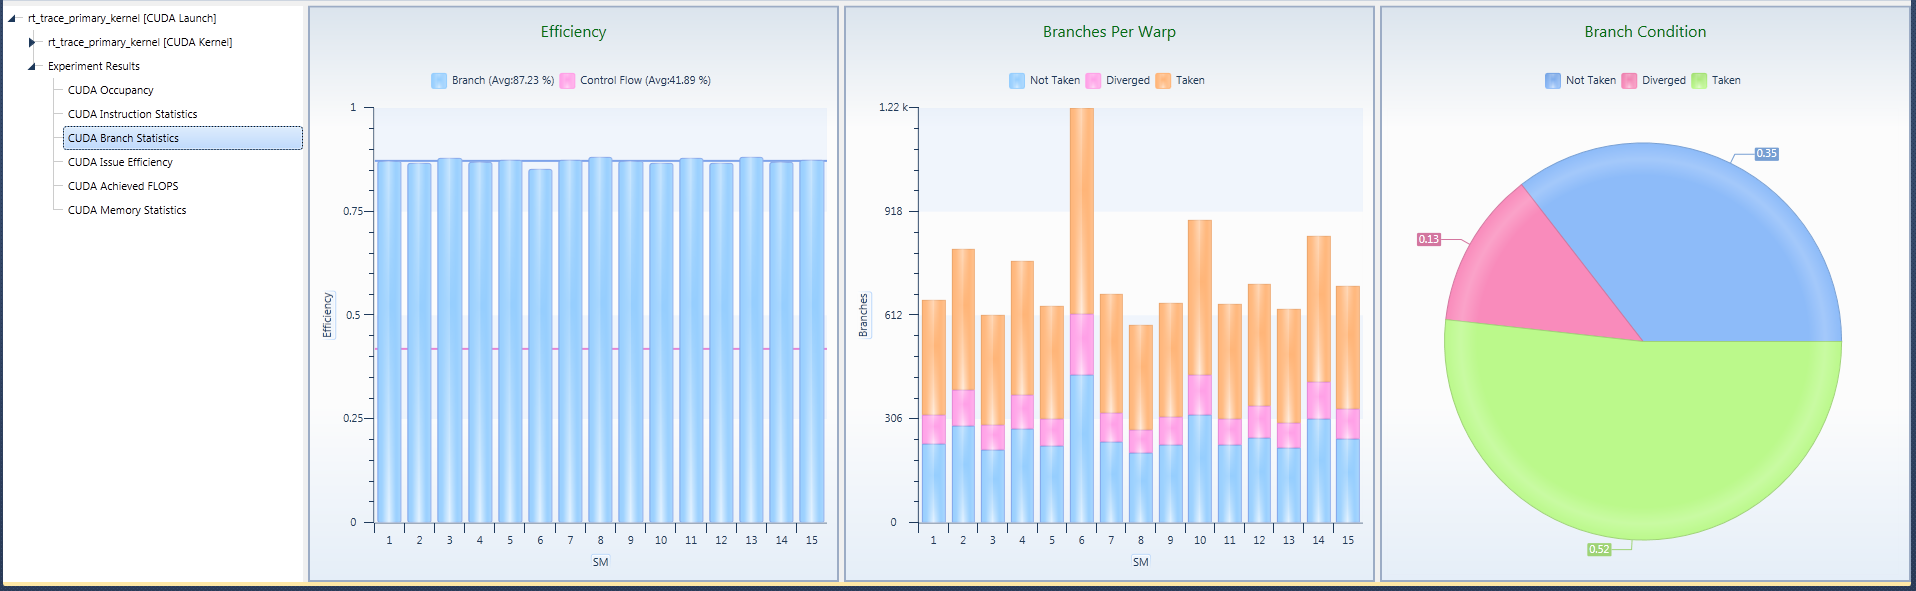
Experiment Details Pane
Flow control can have a serious impact on the efficiency of executing a kernel. This is even more likely if a lot of flow control decisions are divergent, forcing the threads of a warp into highly different control path throughout the kernel. Therefore, it is important to understand how often flow control decisions are made, how many of them are divergent, and how much they affect overall performance.
Branch Efficiency is the ratio of uniform flow control decisions, over all conditionals executed. The lower this metric, the more often warps split their control flow. This may lead to lowered overall execution performance.
Control Flow Efficiency provides an estimate on an upper bound for the usage of all available compute resources based on the executed flow control. That is, the lower this efficiency values becomes, the more compute resources are left idle while executing the kernel.
|
|
There are many ways a conditional expression written in CUDA C can be translated to final assembly code. Note that not all possible variants of a conditional operation can be accounted for with this metric. Hence, it is valid to state that a low control flow efficiency definitely indicates a performance issue. However, the reverse might not necessarily be true – and a kernel exposing a close-to-optimal control flow efficiency might still be impacted by flow control.
|
To further look into the distribution of uniform versus divergent flow control decisions, the Branches Per Warp and the Branch Condition provide the total counts of conditionals made, and their respective percentage ratios. Both metrics are provided for each of the three outcomes of an assembly conditional: Not Taken the branch, Diverged due to an ambiguous evaluation of the conditional across the threads of a warp, and Taken the branch.
Memory Statistics
The memory statistics experiment consists of various sub-experiments that contribute to a combined in-depth view of a kernel’s usage of the CUDA memory hierarchy. Having individual tests, rather than one monolithic experiment, allows limiting the data collection to specific memory spaces only. For overall performance reasons, it is recommended to enable only the sub-experiments covering the memory spaces that are being used by the kernel program.
Experiment Details Pane
If at least one memory sub-experiment was collected, the overview tab of the memory experiment becomes available. In addition, each individual sub-experiment will also provide its own custom visualization tab. For all tabs, the data is presented in a graphical representation, as well as in tabular form.
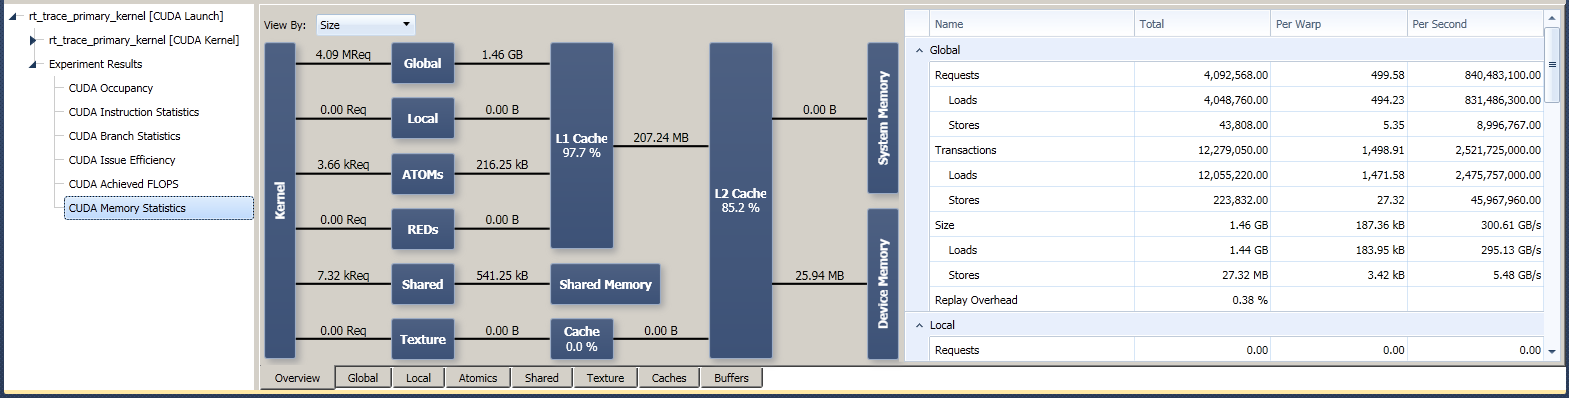
The overview page provides a high level view of all memory transactions made from the kernel. The chart represents the local view of the CUDA memory hierarchy, with the kernel’s requests coming in on the left:
- Requests are an aggregate count of all memory operations made by the kernel into a specific memory space.
- Transactions denote actual memory being copied from one location to another. A transaction moves a fixed-sized segment of memory, no matter if the full segment or only a fraction of it is requested.
- Size is given in multiples of bytes (e.g., 1024 bytes = 1 kilobyte). It’s defined as the number of transactions times the transaction size.
- Bandwidth is given as the transaction size over the total time for executing the kernel. This can be used to help identify bottlenecks in the memory usage of the kernel.
- Hit Rates are a metric of the efficiency of a memory cache. It is given as the percentage of requests made to the cache system.
The individual visualization tabs of the sub-experiment provide further details and additional metrics for a specific memory space. Where applicable, these pages provide the number of Transactions Per Request necessary to complete the memory operation. Depending on the memory pattern and the number of threads actively participating in a memory request, one or multiple transactions might be required to complete the operation. Each transaction causes the memory operation to be issued once. In case of high number of transactions per request, try optimizing your memory access pattern in order to make them more coherent and better aligned with the cache lines.
RAW Counters
The RAW Counter experiment provides the ability to collect and analyze performance data as collected at runtime on the device. The configuration panel on the activity page allows specifying the set of counters to be collected for the targeted GPU device.
Two variants of the RAW Counter experiment exist. The RAW Counters – Tesla Architecture experiment handles all cards based on the Tesla architecture, while the Fermi and Kepler architectures are both covered by the RAW Counters – Fermi/Kepler experiment.
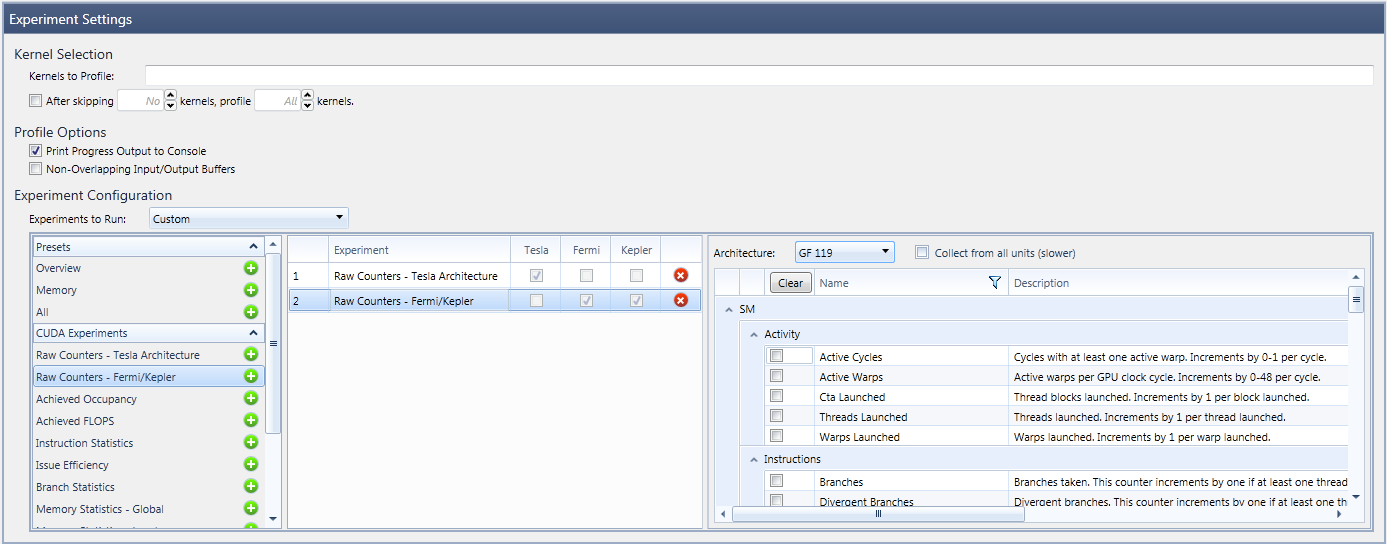
As only a limited number of performance counters can be collected at a time, the selection of counters limits the list of counters to choose, based on the already selected counters. However, multiple instances of the RAW counter experiment can be added to a profile activity. This efficiently allows you to collect a broad set of performance counters, as well as allow configuring different sets of counters to be collected per target device.
- The Architecture dropdown menu sets the target GPU architecture for the RAW counter experiment. Note that the list of available counters will vary with the selected architecture; in addition, the experiment is only collected for kernels that get launched on a device that exactly matches the experiment’s configuration. For all other devices, this experiment instance is ignored. This way, different sets of counters can be collected for multiple GPUs of different architectures in a single capture.
- The Collect from all units checkbox is available for Fermi and Kepler architecture only. By default, the RAW Counter experiment collects the list of selected counters from as many units as possible in a single pass. However, in many cases it is only possible to collect a counter for all available units of a device at once.
For example, a counter collecting data per SM might not be collected from all SMs of a GPU in one pass, but instead, it might be collected from few SMs only by default. As an alternative, this checkbox allows the user to change that behavior in favor of collecting from all units, even if it takes multiple passes.
In the given example, collecting the requested data from all SMs might take several passes with this option enabled, but the coverage of the counter collection increases. Note that using multiple passes to collect a counter value from all units may introduce an error by itself (especially for highly non-uniform workloads). However, the error is typically lower than collecting from a small subset of the units.
|
|
Note that multiple instances of the RAW counters are collected using multiple replayed launches of the target kernel. Even though operating on the exact same input data, there might be observable variations in execution the replay passes. As a consequence, RAW counters covering only a subset of the GPU device might expose variations across the replay passes. In case a metric requires input values from multiple replay passes, it is recommend that you sample at least one counter across all involved experiment passes, and use this counter for normalizing counter values across the experiments.
|
Replay Passes
| 1 Pass |
All Tesla cards |
| 1 Pass |
All Fermi and Kepler cards (if Collect from all units is disabled) |
| 1-8 Passes |
All Fermi and Kepler cards (if Collect from all units is enabled) |
Profiler Triggers
Profiler triggers n: 00 to 07. To use profile triggers, add the following statement to kernel code:
__prof_trigger(n);
where n is a two digit whole number: 01, 02, 03, etc., up to 07.
Report Page
The results of the RAW Counter experiments are reported in two places:
- The RAW counter values are available as extra columns in the CUDA Launches Page (scroll to the right to show those additional columns).
- The correlation details provide an additional view of the collected counter data.
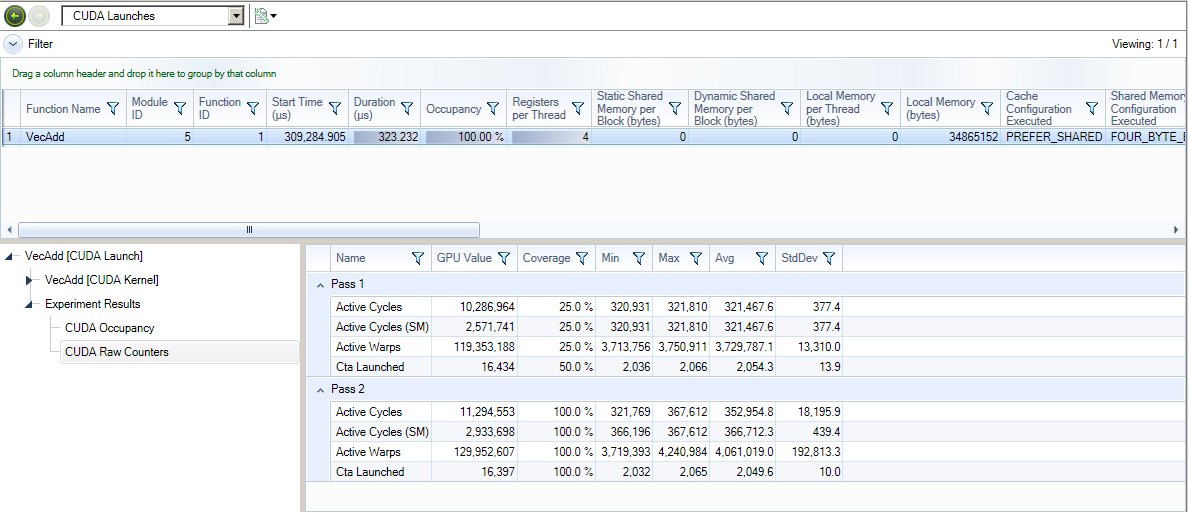
For Fermi and Kepler architectures, the columns in the output include:
- Name - The name of the counter from the RAW Counter Experiment UI.
- GPU Value - For Fermi and Kepler architectures, this is the counter result in respect to the whole GPU. In other words, this is an estimated value for the GPU if the experiment was unable to collect from all units. This may happen if the coverage is not 100%, or if multiple passes were needed to collect from all units.
- Coverage - The percentage of how many units from which data was collected.
- Min - The minimal counter value of a single unit from which data was collected.
- Max - The maximum counter value of a single unit from which data was collected.
- Avg - The average value across all units that from which data was collected.
- StdDev - The standard deviation across all units from which data was collected.
For the Tesla architecture, the columns in the output include:
- Name - The name of the counter from the RAW Counter Experiment UI.
- GPU Value - For Tesla architecture, this field simply contains the RAW counter value as collected from the device.
| NVIDIA® Nsight™ Development Platform, Visual Studio Edition User Guide Rev. 2.2.120522 ©2009-2012. NVIDIA Corporation. All Rights Reserved.
|
|
| |
|